# DevTools
Source: https://inspectorlab.dev/
> For the complete documentation index, see [llms.txt](https://inspectorlab.dev/llms.txt).
# Inspector Lab DevTools
Inspector Lab is a movable, resizable in-page inspector built as a Manifest V3 Chrome extension. It brings full DevTools capabilities directly to your page—Elements inspection with live styles and DOM editing, console capture and evaluation, network monitoring, and storage editing—running on desktop Chrome, Chromium browsers, and iPadOS through [Orion by Kagi](https://help.kagi.com/orion/browser-extensions/ios-ipados-extensions.html). Released under the MIT license.
## Why Inspector Lab exists
Modern development increasingly means supervising agents and remote systems rather than typing code directly. When your work happens on a remote machine and you verify it from a tablet, the DevTools you rely on disappear—iPadOS has no F12, and desktop Chrome's inspector cannot run there at all.
Inspector Lab solves this by embedding a full inspection window directly into the page as a browser extension. Because it uses only content scripts and standard extension APIs—no debugger protocol—it runs anywhere a browser can load an extension: desktop Chrome, Chromium variants, and Orion on iPad and iPhone.
## What you get
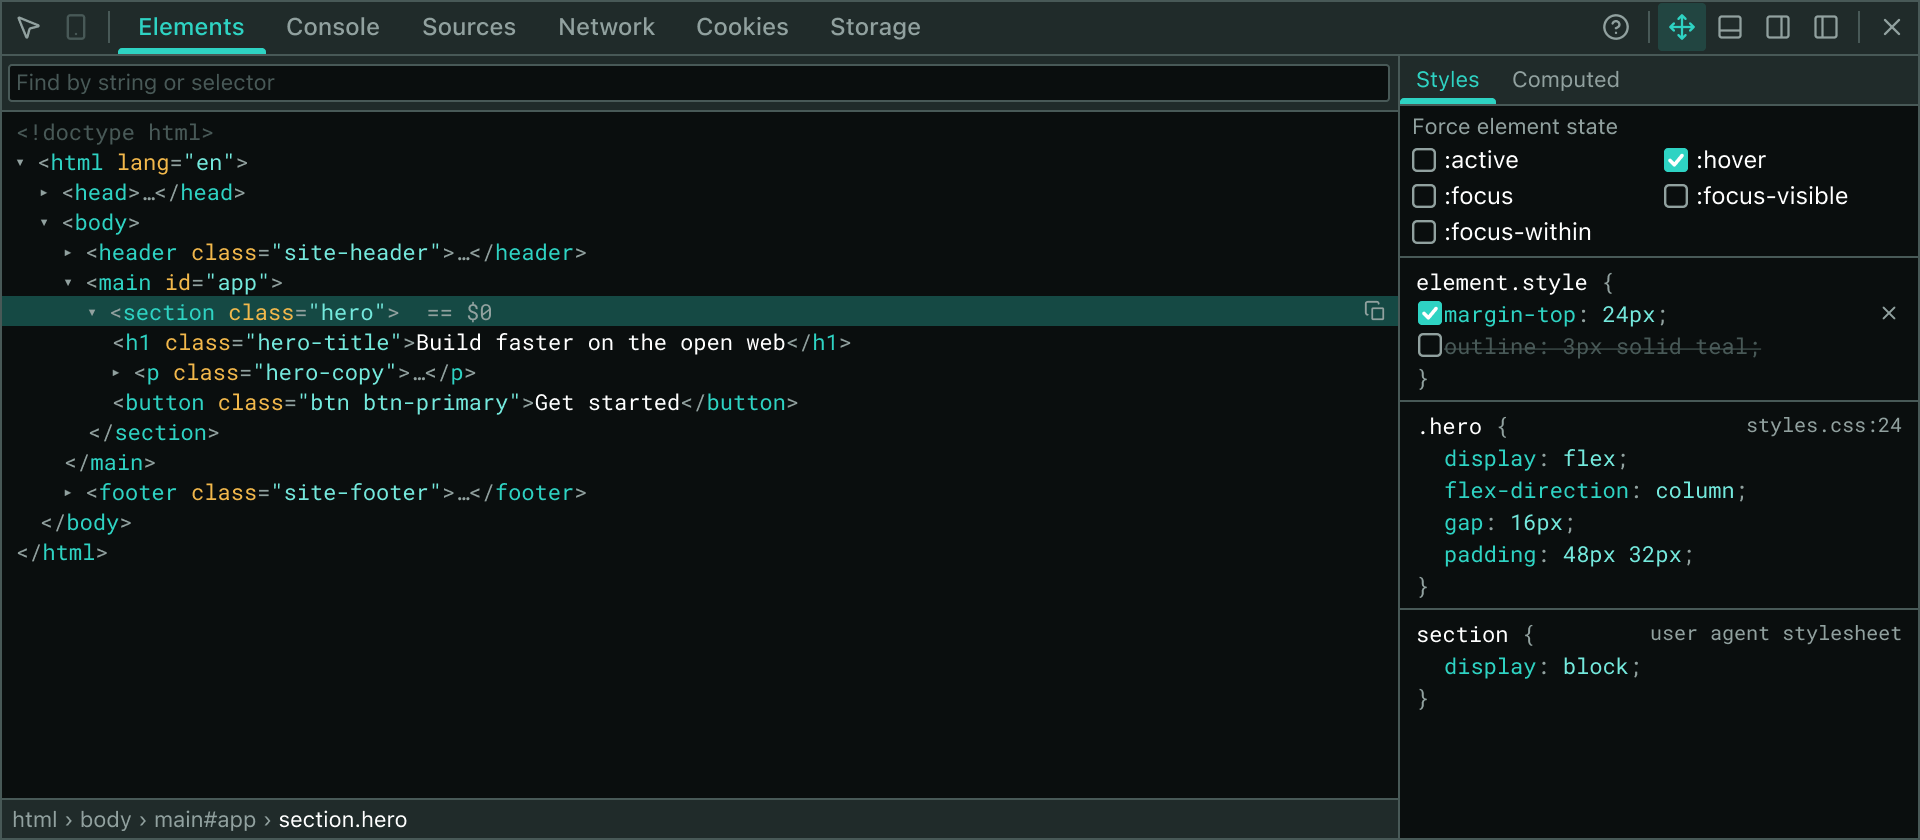
- **Elements Panel**: Pick and highlight elements, edit attributes and text in place, apply validated inline CSS, view computed styles with a box-model diagram, and force element states.
- **Console**: Capture page output, evaluate expressions in the page context, view values colored by type with `file:line` source links.
- **Network**: Record live requests with headers, timing, and fetch/XHR body inspection; DevTools-style details pane for each request.
- **Sources**: Browse page sources in a collapsible tree with syntax highlighting; external files fetch on demand.
- **Cookies & Storage**: Edit cookies, local storage, and session storage in place.
- **UI**: Floats or docks to any viewport edge, resizable, themed light and dark, persists across reloads until closed.
The extension launches from the popup on your demand, using only temporary `activeTab` permission—no standing access to every site you visit.
## Getting started
Install Inspector Lab in one click from the Chrome Web Store — this works on desktop Chrome, Chromium browsers, and Orion on iPad and iPhone, and updates automatically:
### Building from source
Prefer to run a local build for development? Requires Node 20+ and pnpm 9+.
```bash
git clone git@github.com:luangjokaj/inspector-lab.git
cd inspector-lab
```
```bash
pnpm install
```
```bash
pnpm dev
```
Open `chrome://extensions`, enable **Developer mode**, click **Load unpacked**, and select `apps/extension/build/chrome-mv3-dev`. The build reloads as you edit.
Inspector Lab works on iPad via [Orion by Kagi](https://orionbrowser.com/), a free browser for iOS and iPadOS. All panels—Elements, Console, Sources, Cookies, and Storage—work fully. The Network panel captures live fetch and XHR traffic; where iOS limits the extension API surface, panels fall back gracefully and indicate what is unavailable.
### iPad installation
On iPad and iPhone, enable Chrome extensions once in Orion (**⋯ → Extensions → Chrome extensions**), then open the [Chrome Web Store listing](https://chromewebstore.google.com/detail/inspector-lab-devtools/jhpgckgieinonbibmjdgejephdmdogle) and tap install — no Files app, no sideloading. The installation guide covers this plus the manual sideloading flow for local builds.
Full tour of every panel, keyboard shortcuts, device support, and known limitations.Detailed steps for desktop and iPad, development build setup, and troubleshooting.Honest boundaries: what Inspector Lab can and cannot do, and why.Set up a dev environment, run the build, and contribute to the project.
## Explore the panels
DOM tree, live styles, attribute editing, forced states, and computed values with box model.Page output capture, expression evaluation, and source link navigation.Live request recording, headers, timing, and response body inspection for fetch and XHR.Collapsible source tree with syntax highlighting and on-demand file fetching.View, edit, add, and delete cookies with full access to all attributes.In-place editing of local storage and session storage.
## Under the hood
Component structure, page bridge, injection, React rendering, and Shadow DOM isolation.Content script, background, and popup communication; request-response patterns.Safe DOM access, data serialization, and lifecycle management from content scripts.Light and dark themes, Cherry UI integration, and custom CSS with DevTools fallback mode.
## Advanced topics
Inspect non-HTML documents and SVG with full tree editing support.Theme preferences and per-tab inspector state stored locally.What Inspector Lab collects (nothing), stores (only preferences), and transmits (never).
## Open source
Inspector Lab is built with [Plasmo](https://www.plasmo.com/) and released under the [MIT license](https://github.com/luangjokaj/inspector-lab/blob/main/LICENSE). The code is on [GitHub](https://github.com/luangjokaj/inspector-lab)—issues and pull requests are welcome. If you are planning a larger change, open an issue first to discuss it.
**[View the changelog →](/changelog)**