# Inspector Lab
> Full documentation for Inspector Lab.
The DevTools that goes where Chrome's can't
---
# DevTools
Source: https://inspectorlab.dev/
# Inspector Lab DevTools
Inspector Lab is a movable, resizable in-page inspector built as a Manifest V3 Chrome extension. It brings full DevTools capabilities directly to your page—Elements inspection with live styles and DOM editing, console capture and evaluation, network monitoring, and storage editing—running on desktop Chrome, Chromium browsers, and iPadOS through [Orion by Kagi](https://help.kagi.com/orion/browser-extensions/ios-ipados-extensions.html). Released under the MIT license.
## Why Inspector Lab exists
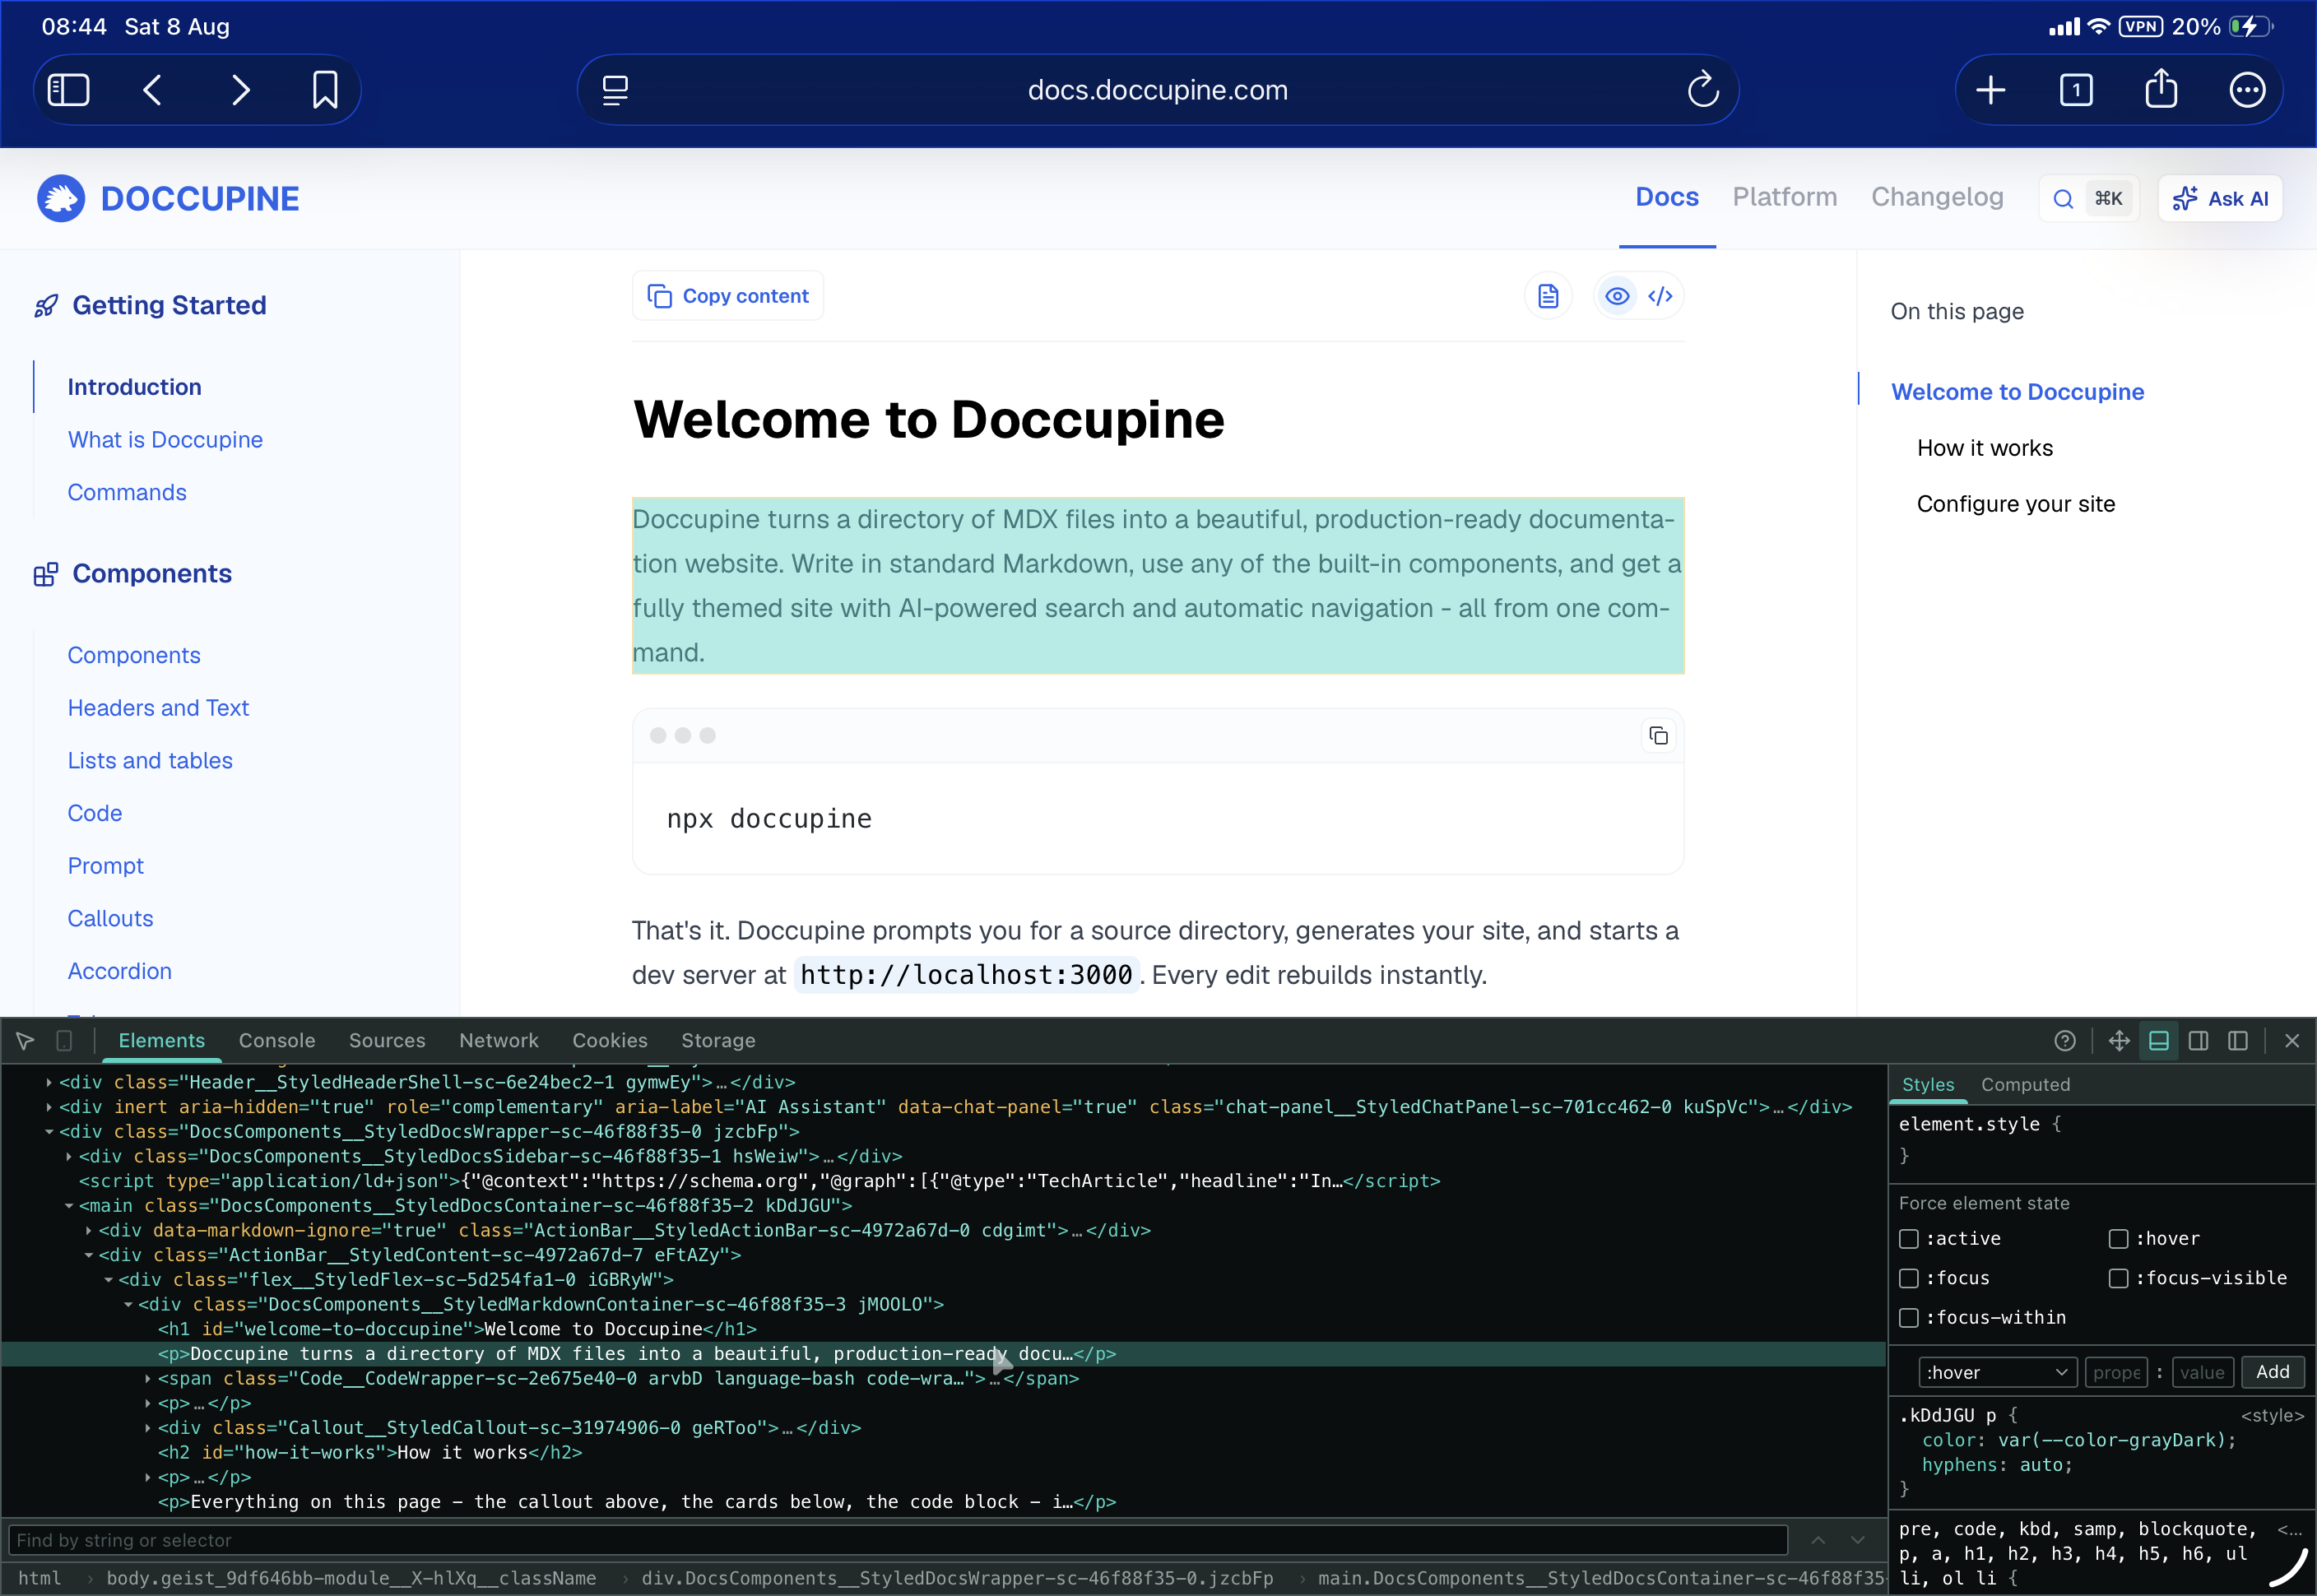
Modern development increasingly means supervising agents and remote systems rather than typing code directly. When your work happens on a remote machine and you verify it from a tablet, the DevTools you rely on disappear—iPadOS has no F12, and desktop Chrome's inspector cannot run there at all.
Inspector Lab solves this by embedding a full inspection window directly into the page as a browser extension. Because it uses only content scripts and standard extension APIs—no debugger protocol—it runs anywhere a browser can load an extension: desktop Chrome, Chromium variants, and Orion on iPad and iPhone.
## What you get
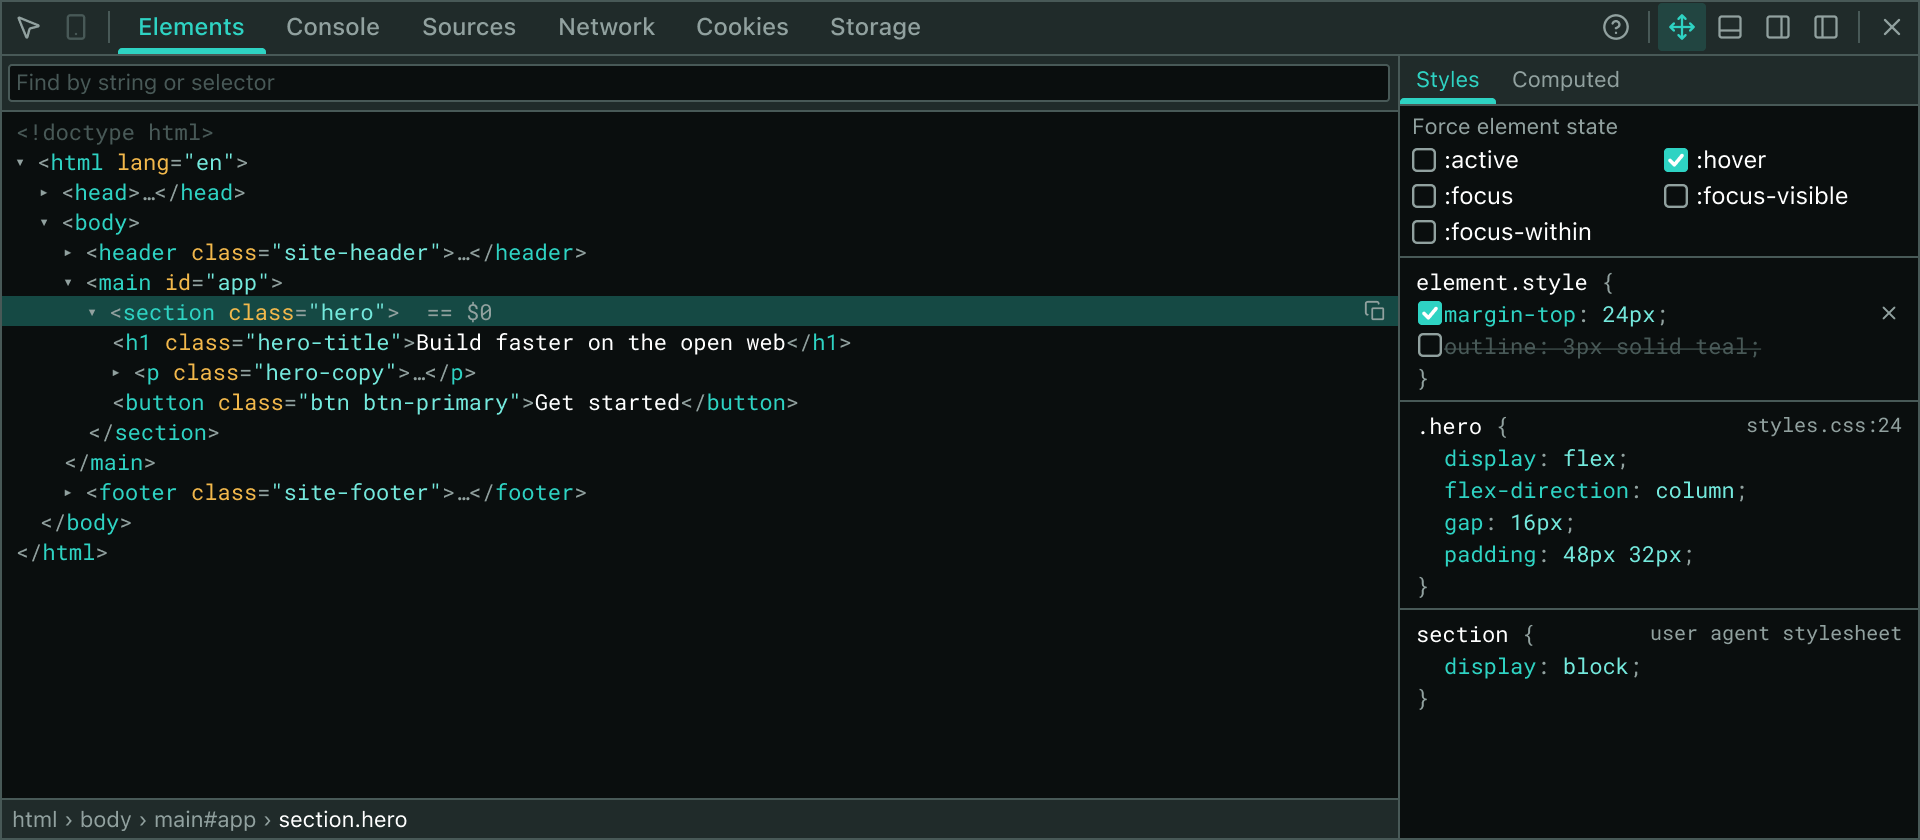
- **Elements Panel**: Pick and highlight elements, edit attributes and text in place, apply validated inline CSS, view computed styles with a box-model diagram, and force element states.
- **Console**: Capture page output, evaluate expressions in the page context, view values colored by type with `file:line` source links.
- **Network**: Record live requests with headers, timing, and fetch/XHR body inspection; DevTools-style details pane for each request.
- **Sources**: Browse page sources in a collapsible tree with syntax highlighting; external files fetch on demand.
- **Cookies & Storage**: Edit cookies, local storage, and session storage in place.
- **UI**: Floats or docks to any viewport edge, resizable, themed light and dark, persists across reloads until closed.
The extension launches from the popup on your demand, using only temporary `activeTab` permission—no standing access to every site you visit.
## Getting started
Install Inspector Lab in one click from the Chrome Web Store — this works on desktop Chrome, Chromium browsers, and Orion on iPad and iPhone, and updates automatically:
### Building from source
Prefer to run a local build for development? Requires Node 20+ and pnpm 9+.
```bash
git clone git@github.com:luangjokaj/inspector-lab.git
cd inspector-lab
```
```bash
pnpm install
```
```bash
pnpm dev
```
Open `chrome://extensions`, enable **Developer mode**, click **Load unpacked**, and select `apps/extension/build/chrome-mv3-dev`. The build reloads as you edit.
Inspector Lab works on iPad via [Orion by Kagi](https://orionbrowser.com/), a free browser for iOS and iPadOS. All panels—Elements, Console, Sources, Cookies, and Storage—work fully. The Network panel captures live fetch and XHR traffic; where iOS limits the extension API surface, panels fall back gracefully and indicate what is unavailable.
### iPad installation
On iPad and iPhone, enable Chrome extensions once in Orion (**⋯ → Extensions → Chrome extensions**), then open the [Chrome Web Store listing](https://chromewebstore.google.com/detail/inspector-lab-devtools/jhpgckgieinonbibmjdgejephdmdogle) and tap install — no Files app, no sideloading. The installation guide covers this plus the manual sideloading flow for local builds.
Full tour of every panel, keyboard shortcuts, device support, and known limitations.Detailed steps for desktop and iPad, development build setup, and troubleshooting.Honest boundaries: what Inspector Lab can and cannot do, and why.Set up a dev environment, run the build, and contribute to the project.
## Explore the panels
DOM tree, live styles, attribute editing, forced states, and computed values with box model.Page output capture, expression evaluation, and source link navigation.Live request recording, headers, timing, and response body inspection for fetch and XHR.Collapsible source tree with syntax highlighting and on-demand file fetching.View, edit, add, and delete cookies with full access to all attributes.In-place editing of local storage and session storage.
## Under the hood
Component structure, page bridge, injection, React rendering, and Shadow DOM isolation.Content script, background, and popup communication; request-response patterns.Safe DOM access, data serialization, and lifecycle management from content scripts.Light and dark themes, Cherry UI integration, and custom CSS with DevTools fallback mode.
## Advanced topics
Inspect non-HTML documents and SVG with full tree editing support.Theme preferences and per-tab inspector state stored locally.What Inspector Lab collects (nothing), stores (only preferences), and transmits (never).
## Open source
Inspector Lab is built with [Plasmo](https://www.plasmo.com/) and released under the [MIT license](https://github.com/luangjokaj/inspector-lab/blob/main/LICENSE). The code is on [GitHub](https://github.com/luangjokaj/inspector-lab)—issues and pull requests are welcome. If you are planning a larger change, open an issue first to discuss it.
**[View the changelog →](/changelog)**
---
# Why Inspector Lab
Source: https://inspectorlab.dev/about
## Why Inspector Lab
Inspector Lab - DevTools is a Chrome extension that brings a full developer-tools window directly onto the page you're working with. It includes an Elements tree, live styles, forced states, a console with evaluation, network requests with headers and response bodies, sources, cookies, and storage. It floats or docks on demand, survives page reloads, and maintains the look and behavior of traditional DevTools so your muscle memory stays intact.
But this raises an obvious question: browsers already ship with DevTools, so why build one as an extension?
### The Way We Work Changed
The nature of development has shifted fundamentally. Much code is no longer written by hand—agents and AI systems generate it. The developer's role has evolved from typing to orchestration and supervision: describing what should exist, reviewing what came back, and verifying it actually works.
That verification step still requires real tools. You open the app, inspect the DOM, watch a request fire, check what landed in a cookie. But once your work becomes supervising rather than typing, where you sit stops mattering.
Like many developers today, remote development has become the norm. Code lives on a VPS, agents run there, and you connect from whatever device is in front of you—often an iPad on a couch, in a train, or anywhere else. Remote development from a tablet is no longer a novelty; it's how modern development genuinely happens.
And that's where the tooling breaks down.
### The Tablet Browser Has No F12
On a laptop, verifying work is straightforward: open the page, hit F12. On an iPad, there is no F12. iPadOS browsers ship without developer tools, and Apple's restrictions mean you cannot get desktop Chrome's inspector there at all. You can see your app, but you cannot look inside it.
What iPadOS does offer, thanks to one browser in particular, is extension support. [Orion by Kagi](https://help.kagi.com/orion/browser-extensions/ios-ipados-extensions.html) runs Chrome and Firefox web extensions on iOS and iPadOS. Support is still maturing and not every extension API exists there, but it works, and it's the only option on an iPad.
The solution became clear: if the browser won't provide DevTools but will run an extension, then DevTools should _be_ an extension. Everything Inspector Lab does happens through content scripts and standard extension APIs on the page itself—no debugger protocol, no desktop-only surfaces. If a browser can run the extension, you get an inspector on the device you're actually holding.
### The Wider Landscape
Orion is why this project exists, but it's not entirely alone:
- **Orion (iOS / iPadOS)**: Runs Chrome and Firefox extensions natively. The primary target for Inspector Lab outside the desktop.
- **Firefox for Android**: Has an [official add-ons catalog](https://alternativeto.net/news/2023/8/mozilla-to-reintroduce-full-browser-extension-support-for-firefox-android-app) again since late 2023. Requires a Firefox-specific port, but the door is open.
- **Microsoft Edge for Android**: Ships an [extension store](https://www.howtogeek.com/microsoft-edge-on-android-has-extensions-now/), having absorbed extension support from Kiwi Browser when [Kiwi was discontinued in early 2025](https://www.neowin.net/news/kiwi-browser-takes-final-breath-but-at-least-some-of-it-will-live-on-in-microsoft-edge/). The catalog is curated and still small.
- **Desktop Chrome and every Chromium browser**: Works today, and it's surprisingly pleasant even when F12 exists. A movable inspector that lives inside the viewport, remembers its panel per site, and returns after every reload is useful everywhere.
Chrome itself supports no extensions on iPad or Android, which still surprises many people.
### What It Is Not
Inspector Lab does not attempt to replace the full DevTools application. Some capabilities genuinely require the debugger protocol: breakpoints, CPU profiles, bypassing a page's Content Security Policy. The [feature tour](/features) is honest about every boundary.
The goal is different: enabling the twenty inspections you actually perform every day, on any machine that runs a browser extension, two taps from the page you're supervising.
Built by a developer who reviews more code than they write now, for everyone working the same way.
---
Explore what Inspector Lab can do.Get started with Inspector Lab.
---
# Installation & Setup
Source: https://inspectorlab.dev/installation
# Installation & Setup
Inspector Lab installs in one click from the Chrome Web Store on desktop Chrome, Chromium browsers, and Orion — including iPadOS and iOS. Installing from source remains available for development and for sideloading a local build.
Inspector Lab is live on the [Chrome Web Store](https://chromewebstore.google.com/detail/inspector-lab-devtools/jhpgckgieinonbibmjdgejephdmdogle). This is the primary install path on every supported browser, including Orion on iPad and iPhone — one click, no build step, automatic updates.
## Install from the Chrome Web Store
Go to [Inspector Lab - DevTools on the Chrome Web Store](https://chromewebstore.google.com/detail/inspector-lab-devtools/jhpgckgieinonbibmjdgejephdmdogle). On iPad or iPhone, follow [Orion on iPadOS and iOS](#orion-on-ipados-and-ios) below instead.
Click **Add to Chrome** (Orion shows its own install prompt) and confirm. The extension appears in your toolbar, ready to use. Store installs update automatically as new versions are published.
That is the whole install for desktop. Everything below covers Orion on iOS/iPadOS, macOS, and building from source — only needed for sideloading or development.
---
## Orion on iPadOS and iOS
[Orion by Kagi](https://orionbrowser.com/) is the only iPad browser that runs Chrome extensions and is [free for iPhone and iPad](https://apps.apple.com/app/id1484498200). Install Orion first if you have not already.
### Step 1 — Enable Chrome extensions (once)
Tap the **three dots** (**⋯**) in the toolbar and choose **Extensions**.
Turn on **Chrome extensions**.
### Step 2 — Install Inspector Lab from the store
Tap **⋯ → Extensions** (you are already there if you just enabled Chrome extensions).
Tap the **+** button in the bottom right, then choose **Install from the Chrome Web Store**.
Search for **Inspector Lab - DevTools** or open [the listing](https://chromewebstore.google.com/detail/inspector-lab-devtools/jhpgckgieinonbibmjdgejephdmdogle) directly and confirm. It appears in your extensions list.
Orion may warn about compatibility during install — the warning is informational and expected. The extension is built for iOS's reduced API surface and works as designed.
### Step 3 — Use the inspector
Check that **Inspector Lab - DevTools** is enabled in the Extensions list.
Navigate to any normal website (`http://` or `https://`).
Tap the extension icon in the toolbar, then tap **Inspector Lab - DevTools**, then tap **Open page inspector**.
**Allow site access** when Orion asks. The Cookies panel stays empty without it, and console capture from page load also needs it.
The inspector docks to the bottom of the page. Drag the toolbar to tear it off into a floating window, or use the dock buttons to pin it to another edge. It survives page reloads until you close it with the **X**.
---
## What to expect on iOS and iPadOS
Kagi documents iOS and iPadOS extension support as **beta with a reduced API surface**, because Apple caps what any iOS browser may expose. Inspector Lab is built for that: wherever the extension background cannot be reached, panels fall back to in-page sources instead of going dark, and each one says on screen which source it is using.
**Verified on a real iPad:**
| Panel | Status | Notes |
|-------|--------|-------|
| **Elements** | Works | Fully in-page; no extension APIs needed. |
| **Console** | Works | Captures logs and evaluates expressions. Falls back to in-page scripts when the extension does not answer. Corrects iOS Smart Punctuation automatically — type `console.log("log")` and the keyboard's curly quotes and em-dashes are fixed if they blocked parsing. Sites whose Content Security Policy forbids inline scripts or `eval` block the fallback — the error says so. |
| **Sources** | Works | Fully in-page; no extension APIs needed. |
| **Cookies** | Works | Lists, adds, edits, and deletes cookies. Falls back to `document.cookie` when extension is unreachable; cannot see HttpOnly cookies in fallback mode. |
| **Storage** | Works | Fully in-page; no extension APIs needed. |
| **Network** | Partial | Captures fetch/XHR live with headers and bodies. Static resources (documents, stylesheets, images, fonts) come from the Performance timeline without header details, because `chrome.webRequest` is not available on iOS. |
If a panel reports a specific error instead of data, that message is the ground truth — it names the API or policy that refused, rather than a generic connection failure.
---
## Orion on macOS
Orion on macOS installs Chrome Web Store extensions directly and exposes the fuller desktop API surface. Open [the Chrome Web Store listing](https://chromewebstore.google.com/detail/inspector-lab-devtools/jhpgckgieinonbibmjdgejephdmdogle) in Orion and install. For the current extension settings menu (which moves between Orion releases), see [Kagi's extension documentation](https://help.kagi.com/orion/browser-extensions/browser-extensions.html).
---
## Build and sideload from source
Clone the repository and build the unpacked extension:
```bash
git clone git@github.com:luangjokaj/inspector-lab.git
cd inspector-lab
pnpm install
```
```bash
pnpm build
```
This writes the unpacked extension to `apps/extension/build/chrome-mv3-prod/`. That folder **is** the extension — `manifest.json` sits at its top level.
If you are installing on iPad or iPhone, create a 1.2 MB zip to transfer:
```bash
pnpm package
```
This generates `apps/extension/build/chrome-mv3-prod.zip`.
---
## Desktop Chrome, Edge, Brave, and Chromium (local build)
Once you have built the extension:
Navigate to `chrome://extensions` in your browser.
Toggle **Developer mode** in the top right corner.
Click **Load unpacked** and select `apps/extension/build/chrome-mv3-prod`.
The extension is now installed and ready to use. For development, run `pnpm dev` instead of `pnpm build` — this writes to `apps/extension/build/chrome-mv3-dev` and reloads as you edit. Load that folder the same way.
---
## Orion on iPadOS and iOS (sideloaded build)
Store installs are strongly recommended — they update automatically. Sideload only when testing unreleased changes. Sideloaded extensions never auto-update.
Orion's file installer only lists folders that are already in its own Extensions directory, so the folder must be moved there before you open Orion's extension screen.
### Get the folder onto the iPad
Move `chrome-mv3-prod.zip` to your iPad via AirDrop, iCloud Drive, or browser download. It normally lands in the **Downloads** folder in the Files app.
Open the **Files** app, find the zip, long-press it, and tap **Uncompress**. You get a folder named `chrome-mv3-prod`.
In Files, go to **Browse → On My iPad → Orion → Extensions**.
If no **Orion** folder exists, open the Orion app once — it creates the folder on first launch — then look again. Orion's own file picker calls this location **On This iPad** instead of **On My iPad**, but it is the same place.
Long-press the `chrome-mv3-prod` folder, tap **Move**, and pick `Orion/Extensions`. Dragging it across in Split View also works.
At this point, `On My iPad → Orion → Extensions → chrome-mv3-prod` exists and contains `manifest.json`. The extension is not yet installed in Orion.
### Install in Orion
Open **Orion**, tap the **three dots** (**⋯**) in the toolbar, then tap **Extensions**.
Tap the **+** button in the bottom right and choose **Install from File**.
The folder picker opens. Select the **`chrome-mv3-prod`** folder you moved in the previous step — pick the _folder itself_, not a file inside it.
Confirm. Orion installs it, and **Inspector Lab - DevTools** appears in the extensions list.
### Updating a sideloaded build
Sideloaded extensions never auto-update. To move to a newer build:
1. Delete the old `chrome-mv3-prod` folder from **On My iPad → Orion → Extensions**.
2. Drop the new one in its place using the steps above.
3. Install it again using the **+ → Install from File** flow.
Removing the old folder first matters — two folders with the same manifest name make the picker ambiguous.
---
## Troubleshooting
The picker only browses Orion's own Extensions directory. The folder must be at **On My iPad → Orion → Extensions**, not in Downloads or iCloud Drive.
Orion needs the unpacked folder. Long-press the zip, tap **Uncompress** first, then move the resulting folder.
Select the `chrome-mv3-prod` folder itself, not a file inside it. The installer reads `manifest.json` from the folder's top level.
Launch Orion once. The folder is created on first run.
The inspector only runs on `http://`, `https://`, and `file://` pages. Browser settings pages and other internal URLs are protected and out of reach for any extension.
Site access was not granted. Relaunch from the popup and allow it when asked.
---
## Next steps
Once the extension is installed and running, explore its capabilities:
Learn what each panel does and how to use it.Start inspecting and editing the DOM.
---
# Features & Capabilities
Source: https://inspectorlab.dev/features
## Overview
Inspector Lab - DevTools is a movable, resizable devtools window that lives directly on the page you are inspecting. Built as a Manifest V3 Chrome extension and rendered inside an isolated Shadow DOM with React, it follows Chrome DevTools conventions closely—your muscle memory just works.
## Launching and Window Management
- **One-click launch** from the toolbar popup. Access uses `activeTab`, granted by your click — no standing permission to read every site.
- **Single instance**: relaunching on a page reveals the existing inspector instead of duplicating it; closing hides it, keeping your state.
- **Survives reloads**: once open, the inspector comes back automatically after every reload (and navigation, where permissions allow) until you close it with X — the same "stays open until dismissed" behavior as DevTools itself. Fully reliable on sites where the per-site permission was granted; same-origin reloads generally work even without it.
- **Per-site panel memory**: the inspector reopens on the panel you last used on that site — Console on one site, Network on another — remembered for the browser session, never mixed across sites.
- **Floating or docked**: drag the window anywhere from its toolbar, resize from any edge or corner, or dock it to the bottom, left, or right of the viewport with a draggable split — the same dock modes DevTools offers.
- **Keyboard-resizable** dock splits and a picker you can cancel with Escape.
For detailed documentation on individual panels, see the linked pages below.
## Elements
- Live DOM tree of the host page with hover highlighting painted over the real elements.
- **Element picker**: point at anything on the page to select it; the tree expands and scrolls to the picked element, and the inspector's own UI is never pickable.
- **Edit the DOM in place**, as in Chrome: double-click an attribute name or value to change it, double-click a tag name to add an attribute (typed as `name="value"`), and double-click a text node to rewrite it. Enter or blur commits, Escape cancels, and Tab walks from a name to its value to the next attribute. Clearing an attribute's name removes the attribute; attribute names are validated before anything touches the element.
- **Styles pane**: matched stylesheet rules with the winning rules on top, plus DevTools-style CSS authoring — click a property or value to edit it in place, click a rule's empty space to start a new declaration, and switch a declaration off with its checkbox instead of deleting it. Every property/value pair is validated before it reaches the page. Checkboxes and delete buttons stay visible on touch, where there is no hover to reveal them.
- **Force element state**, like DevTools' `:hov` panel: check `:active`, `:hover`, `:focus`, `:focus-visible`, or `:focus-within` and the page's own rules for that state apply to the selected element immediately (same-origin stylesheets; cross-origin sheets are counted but unreadable).
- **Per-state CSS authoring**: add and remove your own declarations for any of those states. They apply while the state is forced and on real interaction, without ever touching the page's own stylesheets or DOM attributes.
- **Source links**: every matched rule names its stylesheet, and clicking it jumps to that file in the Sources panel.
- **Computed pane** with a DevTools-style box-model diagram (margin / border / padding / content) and a filterable list of common computed styles.
- Breadcrumb trail of the selected element's ancestry in the status bar.
- The page's `` is selected at launch so no panel ever starts empty.
## Console
- **Captures page logs** — `console.log`, `info`, `warn`, `error`, and `debug` — by wrapping the console in the page's main world. Entries stream over an unguessable per-launch event channel that page scripts cannot spoof or eavesdrop.
- **Capture from time zero**: on sites where the per-site permission was granted, the wrapper installs at `document_start` before any page script runs, so after a reload the feed includes everything from page boot — early logs are buffered and replayed the moment the inspector opens. Elsewhere, capture starts when the inspector launches.
- **Evaluate expressions** in the page's own JavaScript context from the prompt, with DevTools-style `›` input and `‹` result rows.
- **Values colored by type**, like DevTools: numbers, booleans, and null/undefined logged as arguments — and primitive evaluation results, including quoted strings — render in the same syntax palette the Elements tree uses, in every theme. Error and warning rows keep their level color for the whole line, exactly as Chrome does.
- **Source links**: each captured entry shows the `file:line` it was logged from, right-aligned like DevTools — whenever a page frame can be identified from the call stack.
- **iPad keyboards just work**: iOS Smart Punctuation turns `"log"` into `"log"` and `i--` into `i—` as you type, which JavaScript rejects. When curly punctuation is what stopped an expression from parsing, the prompt retries it straightened — and only then, so a curly apostrophe pasted inside a valid string is never rewritten.
- Filter by text or level, clear the feed, and rely on the same 1,000-entry cap DevTools uses.
- Honest about limits: sites whose Content Security Policy blocks `eval` will say so instead of failing silently.
## Sources
- **Collapsible file tree** of the page's document, stylesheets, and scripts, organized by host and URL folder like DevTools' navigator.
- Inline `
 ### The Wider Landscape
Orion is why this project exists, but it's not entirely alone:
- **Orion (iOS / iPadOS)**: Runs Chrome and Firefox extensions natively. The primary target for Inspector Lab outside the desktop.
- **Firefox for Android**: Has an [official add-ons catalog](https://alternativeto.net/news/2023/8/mozilla-to-reintroduce-full-browser-extension-support-for-firefox-android-app) again since late 2023. Requires a Firefox-specific port, but the door is open.
- **Microsoft Edge for Android**: Ships an [extension store](https://www.howtogeek.com/microsoft-edge-on-android-has-extensions-now/), having absorbed extension support from Kiwi Browser when [Kiwi was discontinued in early 2025](https://www.neowin.net/news/kiwi-browser-takes-final-breath-but-at-least-some-of-it-will-live-on-in-microsoft-edge/). The catalog is curated and still small.
- **Desktop Chrome and every Chromium browser**: Works today, and it's surprisingly pleasant even when F12 exists. A movable inspector that lives inside the viewport, remembers its panel per site, and returns after every reload is useful everywhere.
Chrome itself supports no extensions on iPad or Android, which still surprises many people.
### What It Is Not
Inspector Lab does not attempt to replace the full DevTools application. Some capabilities genuinely require the debugger protocol: breakpoints, CPU profiles, bypassing a page's Content Security Policy. The [feature tour](/features) is honest about every boundary.
The goal is different: enabling the twenty inspections you actually perform every day, on any machine that runs a browser extension, two taps from the page you're supervising.
Built by a developer who reviews more code than they write now, for everyone working the same way.
---
### The Wider Landscape
Orion is why this project exists, but it's not entirely alone:
- **Orion (iOS / iPadOS)**: Runs Chrome and Firefox extensions natively. The primary target for Inspector Lab outside the desktop.
- **Firefox for Android**: Has an [official add-ons catalog](https://alternativeto.net/news/2023/8/mozilla-to-reintroduce-full-browser-extension-support-for-firefox-android-app) again since late 2023. Requires a Firefox-specific port, but the door is open.
- **Microsoft Edge for Android**: Ships an [extension store](https://www.howtogeek.com/microsoft-edge-on-android-has-extensions-now/), having absorbed extension support from Kiwi Browser when [Kiwi was discontinued in early 2025](https://www.neowin.net/news/kiwi-browser-takes-final-breath-but-at-least-some-of-it-will-live-on-in-microsoft-edge/). The catalog is curated and still small.
- **Desktop Chrome and every Chromium browser**: Works today, and it's surprisingly pleasant even when F12 exists. A movable inspector that lives inside the viewport, remembers its panel per site, and returns after every reload is useful everywhere.
Chrome itself supports no extensions on iPad or Android, which still surprises many people.
### What It Is Not
Inspector Lab does not attempt to replace the full DevTools application. Some capabilities genuinely require the debugger protocol: breakpoints, CPU profiles, bypassing a page's Content Security Policy. The [feature tour](/features) is honest about every boundary.
The goal is different: enabling the twenty inspections you actually perform every day, on any machine that runs a browser extension, two taps from the page you're supervising.
Built by a developer who reviews more code than they write now, for everyone working the same way.
---