# Network Panel
Source: https://inspectorlab.dev/panels-network
> For the complete documentation index, see [llms.txt](https://inspectorlab.dev/llms.txt).
# Network Panel
The Network Panel records all HTTP requests made by the page, including fetches, XHR calls, stylesheets, scripts, images, and other resources. It combines live captures from JavaScript-initiated requests with the browser's Performance timeline to give you a complete picture of network activity.
 ## Overview
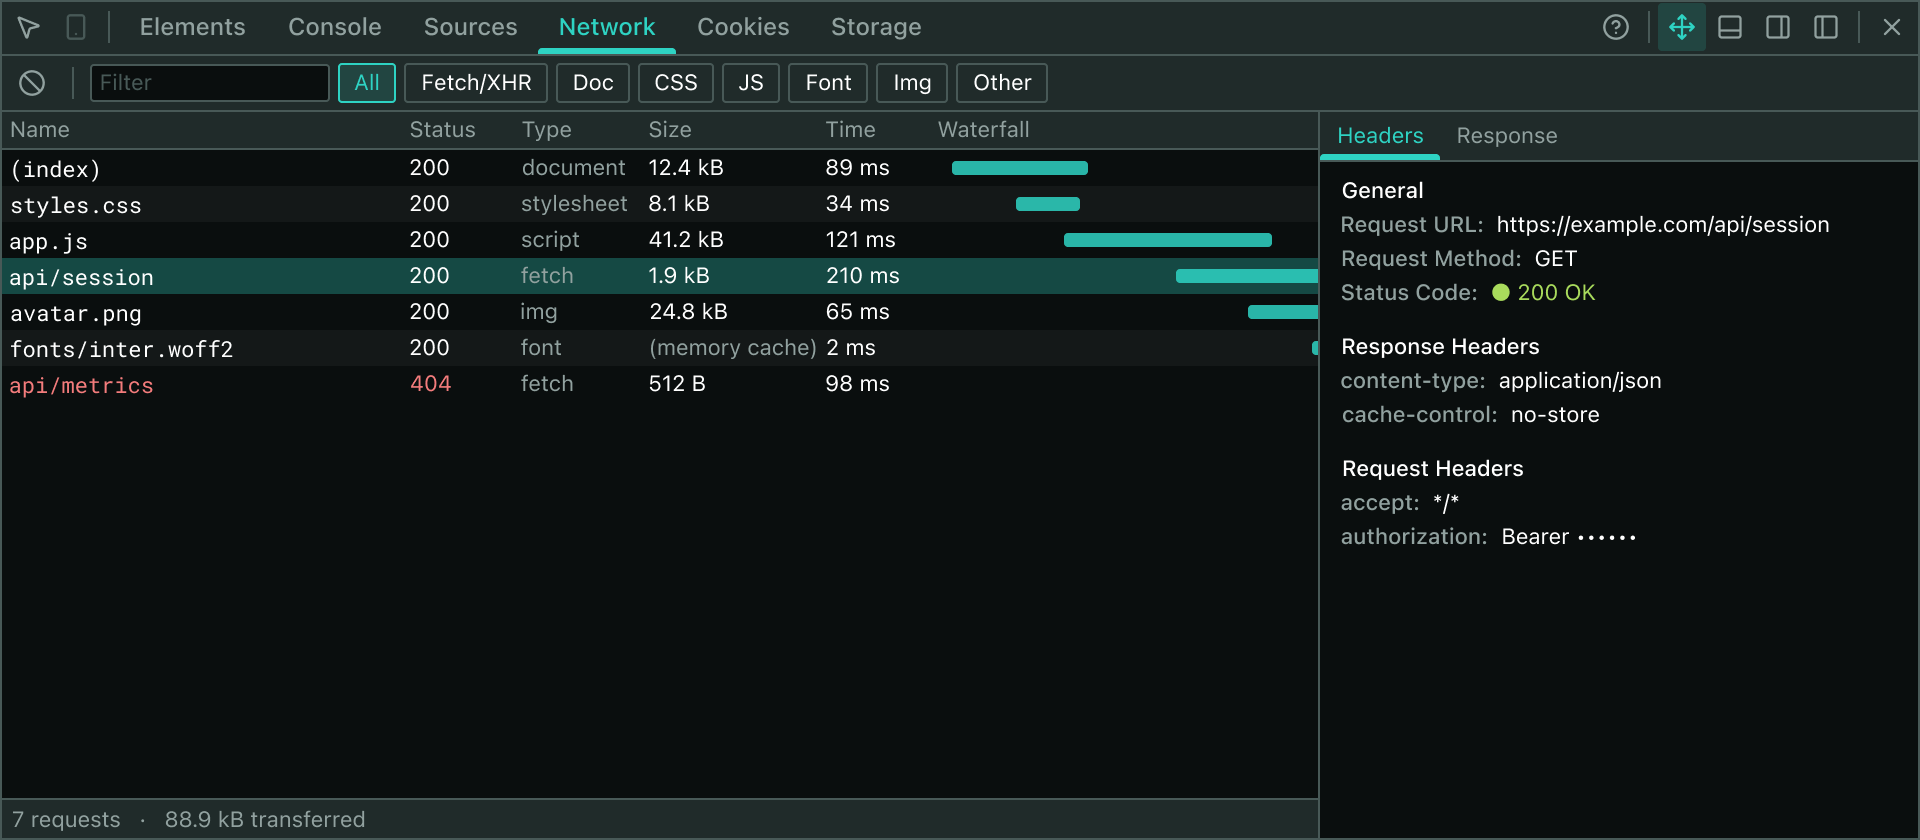
The Network Panel displays a timeline view of all network requests with key metrics:
- **Request details** — URL, HTTP method, status code, request/response headers
- **Performance metrics** — transfer size, duration, time-to-first-byte (TTFB)
- **Visual waterfall** — shows when each request started and how long it took, with a lighter shade indicating time spent waiting for the first byte
- **Request bodies** — captured request and response payloads (capped at 20 KB each)
- **Caching info** — identifies cached vs. freshly-fetched resources
## Data Sources
The panel combines three sources of network data:
1. **Live capture** — Intercepts `fetch()` and `XMLHttpRequest` calls directly in the page's JavaScript context. This gives you full access to request/response headers and bodies, but is limited to JavaScript-initiated requests only.
2. **Performance API** — Reads the browser's built-in performance timeline (`navigation` and `resource` entries). This captures all requests on the page, including those initiated by the HTML parser (images, stylesheets, scripts), but provides only timing and size data—no request/response bodies.
3. **Background webRequest log** — The background worker records HTTP method, status code, and headers via the `chrome.webRequest` API, providing metadata for requests the live capture may miss.
The panel intelligently merges these sources: if a fetch/XHR was captured live, it uses those rich details; otherwise, it falls back to the Performance timeline. The webRequest log is consulted to fill in HTTP method and status for Performance-only entries.
## Toolbar Controls
Make sure the inspector is open **before** the page loads or reloads, so network capture can hook into the page's fetch/XHR before requests are made.
- **Refresh** () — Re-reads the Performance timeline to pick up any new requests. Useful if the page was loading before you opened the inspector.
- **Clear** () — Empties the current request list. New requests will still appear as they are made.
- **Filter** — Type a URL substring to show only matching requests.
- **Type filters** — Click to show only specific resource types:
- **All** — All requests
- **Fetch/XHR** — JavaScript fetch/XHR calls
- **Doc** — Document (navigation, iframes)
- **CSS** — Stylesheets
- **JS** — Scripts
- **Font** — Font files
- **Img** — Images
- **Other** — Unclassified resources
## Request Grid
The main table shows one row per request with these columns:
| Column | Description |
|--------|-------------|
| **Name** | Extracted from the URL pathname; falls back to the hostname if no path is available. |
| **Status** | HTTP status code (e.g., `200`, `404`), `…` for pending requests, or `failed` for errors. Colored green for 2xx, amber for 3xx, red for failures. |
| **Type** | Request type (fetch, document, stylesheet, script, font, img, other). |
| **Size** | Transfer size in bytes. Shows `(memory cache)` for cache hits where no bytes were transferred. |
| **Time** | Duration in milliseconds, or `…` for pending. |
| **Waterfall** | Visual timeline bar showing when the request started and completed, relative to all other requests on the page. A lighter shade shows the time spent waiting for the first byte (TTFB). |
### Waterfall Interpretation
The waterfall bars use a shared timeline axis:
- **Darker section** — Time spent downloading (after TTFB).
- **Lighter section** (if visible) — Time waiting for the first byte (TTFB).
- **Reduced opacity** — Pending request (not yet complete).
- **Red** — Failed request.
Hover over a waterfall bar to see the exact timing: start offset (ms from the first request), total duration, and waiting time.
## Status Bar
Below the request list:
- **Request count** — Total number of requests (after filtering).
- **Transferred** — Total bytes transferred (excluding cached resources).
- **Finish** — Timestamp (in ms) when the last request completed.
## Request Details Sidebar
Click any row to open the details sidebar on the right, showing two tabs:
### Headers Tab
Displays request and response metadata:
- **General**
- **URL** — Full request URL
- **Method** — HTTP method (GET, POST, etc.)
- **Status** — Response status with color indicator and optional error message
- **Duration** — Total request time
- **Request Headers** — Headers sent to the server (truncated at 100 headers and 2 KB per header value)
- **Response Headers** — Headers received from the server (truncated at 100 headers and 2 KB per header value)
- **Cookies** — Request and response cookies (if captured)
A note appears for entries where capture data is unavailable (e.g., "Not captured for this request.").
### Response Tab
Shows the response body, if available:
- **JSON responses** are pretty-printed.
- **Text bodies** are shown as-is.
- **Binary or stream responses** show a placeholder like `(image/png body not captured)` or `(binary blob, 12345 bytes)`.
- **Truncated bodies** are capped at 20 KB; additional data is not shown.
## Limitations
Network capture requires the inspector to be open **before** page load. Requests made before the inspector connects will only appear in the Performance timeline (without request/response bodies).
- **Cross-origin requests without TAO** — Time-to-first-byte (TTFB) is unknown for cross-origin resources that lack a `Timing-Allow-Origin` header; the lighter waiting bar will not appear.
- **Request body capture** — Only available for live fetch/XHR captures. Document, stylesheet, and image requests do not have their request bodies captured (they are typically empty anyway).
- **Response body limits** — Capped at 20 KB per request to avoid memory bloat.
- **Non-text responses** — Binary, Blob, and FormData bodies are not captured; only metadata appears.
- **Header limits** — Headers are truncated at 100 total per section (request or response) and 2 KB per individual header value.
- **Pre-open requests** — If the page loads before the inspector is open, early requests appear in the Performance timeline without live capture details. Use **Refresh** to re-scan.
## Common Workflows
### Debugging a failed request
1. Look for a red status in the **Status** column.
2. Click the row to open details.
3. Check the **Status** line in the **General** section for the error message.
4. Review **Request Headers** and **Response Headers** to verify correct authentication, CORS headers, etc.
5. Check the **Response** tab for server error details or HTML error pages.
### Finding slow requests
1. Sort visually by the **Waterfall** column—longer bars indicate slower requests.
2. Check the **Duration** column for the exact time in milliseconds.
3. Use the waterfall tooltip to see the TTFB breakdown: a long light section means the server was slow to respond; a long dark section means download was slow.
### Identifying cached vs. fetched resources
1. Look at the **Size** column for `(memory cache)` or a byte count.
2. Click the row and check the **General** section in the details sidebar for cache status.
3. The waterfall bar is rendered at reduced opacity for pending requests.
### Filtering by resource type
Use the type filter buttons (CSS, JS, Fetch/XHR, etc.) to focus on specific request categories, then use the text filter to narrow by URL.
## Technical Details
The Network Panel integrates three data sources:
1. **Fetch/XHR capture** — Wraps `window.fetch` and `XMLHttpRequest.prototype` to intercept requests and buffer method, URL, headers, and bodies. Emits phased payloads (`start` → `response` → `body`, or `error`) that are merged by request ID.
2. **Performance API** — `performance.getEntriesByType("navigation")` and `performance.getEntriesByType("resource")` provide timing and size for all resources loaded by the page.
3. **Background webRequest log** — The background worker records HTTP method, status code, and headers via the `chrome.webRequest` API, covering requests that the live capture may miss.
Each request is de-duplicated across sources by matching URL and start time. Live fetch/XHR captures include full headers and request/response bodies; Performance and webRequest entries provide timing, size, method, and status only.
## Overview
The Network Panel displays a timeline view of all network requests with key metrics:
- **Request details** — URL, HTTP method, status code, request/response headers
- **Performance metrics** — transfer size, duration, time-to-first-byte (TTFB)
- **Visual waterfall** — shows when each request started and how long it took, with a lighter shade indicating time spent waiting for the first byte
- **Request bodies** — captured request and response payloads (capped at 20 KB each)
- **Caching info** — identifies cached vs. freshly-fetched resources
## Data Sources
The panel combines three sources of network data:
1. **Live capture** — Intercepts `fetch()` and `XMLHttpRequest` calls directly in the page's JavaScript context. This gives you full access to request/response headers and bodies, but is limited to JavaScript-initiated requests only.
2. **Performance API** — Reads the browser's built-in performance timeline (`navigation` and `resource` entries). This captures all requests on the page, including those initiated by the HTML parser (images, stylesheets, scripts), but provides only timing and size data—no request/response bodies.
3. **Background webRequest log** — The background worker records HTTP method, status code, and headers via the `chrome.webRequest` API, providing metadata for requests the live capture may miss.
The panel intelligently merges these sources: if a fetch/XHR was captured live, it uses those rich details; otherwise, it falls back to the Performance timeline. The webRequest log is consulted to fill in HTTP method and status for Performance-only entries.
## Toolbar Controls
Make sure the inspector is open **before** the page loads or reloads, so network capture can hook into the page's fetch/XHR before requests are made.
- **Refresh** () — Re-reads the Performance timeline to pick up any new requests. Useful if the page was loading before you opened the inspector.
- **Clear** () — Empties the current request list. New requests will still appear as they are made.
- **Filter** — Type a URL substring to show only matching requests.
- **Type filters** — Click to show only specific resource types:
- **All** — All requests
- **Fetch/XHR** — JavaScript fetch/XHR calls
- **Doc** — Document (navigation, iframes)
- **CSS** — Stylesheets
- **JS** — Scripts
- **Font** — Font files
- **Img** — Images
- **Other** — Unclassified resources
## Request Grid
The main table shows one row per request with these columns:
| Column | Description |
|--------|-------------|
| **Name** | Extracted from the URL pathname; falls back to the hostname if no path is available. |
| **Status** | HTTP status code (e.g., `200`, `404`), `…` for pending requests, or `failed` for errors. Colored green for 2xx, amber for 3xx, red for failures. |
| **Type** | Request type (fetch, document, stylesheet, script, font, img, other). |
| **Size** | Transfer size in bytes. Shows `(memory cache)` for cache hits where no bytes were transferred. |
| **Time** | Duration in milliseconds, or `…` for pending. |
| **Waterfall** | Visual timeline bar showing when the request started and completed, relative to all other requests on the page. A lighter shade shows the time spent waiting for the first byte (TTFB). |
### Waterfall Interpretation
The waterfall bars use a shared timeline axis:
- **Darker section** — Time spent downloading (after TTFB).
- **Lighter section** (if visible) — Time waiting for the first byte (TTFB).
- **Reduced opacity** — Pending request (not yet complete).
- **Red** — Failed request.
Hover over a waterfall bar to see the exact timing: start offset (ms from the first request), total duration, and waiting time.
## Status Bar
Below the request list:
- **Request count** — Total number of requests (after filtering).
- **Transferred** — Total bytes transferred (excluding cached resources).
- **Finish** — Timestamp (in ms) when the last request completed.
## Request Details Sidebar
Click any row to open the details sidebar on the right, showing two tabs:
### Headers Tab
Displays request and response metadata:
- **General**
- **URL** — Full request URL
- **Method** — HTTP method (GET, POST, etc.)
- **Status** — Response status with color indicator and optional error message
- **Duration** — Total request time
- **Request Headers** — Headers sent to the server (truncated at 100 headers and 2 KB per header value)
- **Response Headers** — Headers received from the server (truncated at 100 headers and 2 KB per header value)
- **Cookies** — Request and response cookies (if captured)
A note appears for entries where capture data is unavailable (e.g., "Not captured for this request.").
### Response Tab
Shows the response body, if available:
- **JSON responses** are pretty-printed.
- **Text bodies** are shown as-is.
- **Binary or stream responses** show a placeholder like `(image/png body not captured)` or `(binary blob, 12345 bytes)`.
- **Truncated bodies** are capped at 20 KB; additional data is not shown.
## Limitations
Network capture requires the inspector to be open **before** page load. Requests made before the inspector connects will only appear in the Performance timeline (without request/response bodies).
- **Cross-origin requests without TAO** — Time-to-first-byte (TTFB) is unknown for cross-origin resources that lack a `Timing-Allow-Origin` header; the lighter waiting bar will not appear.
- **Request body capture** — Only available for live fetch/XHR captures. Document, stylesheet, and image requests do not have their request bodies captured (they are typically empty anyway).
- **Response body limits** — Capped at 20 KB per request to avoid memory bloat.
- **Non-text responses** — Binary, Blob, and FormData bodies are not captured; only metadata appears.
- **Header limits** — Headers are truncated at 100 total per section (request or response) and 2 KB per individual header value.
- **Pre-open requests** — If the page loads before the inspector is open, early requests appear in the Performance timeline without live capture details. Use **Refresh** to re-scan.
## Common Workflows
### Debugging a failed request
1. Look for a red status in the **Status** column.
2. Click the row to open details.
3. Check the **Status** line in the **General** section for the error message.
4. Review **Request Headers** and **Response Headers** to verify correct authentication, CORS headers, etc.
5. Check the **Response** tab for server error details or HTML error pages.
### Finding slow requests
1. Sort visually by the **Waterfall** column—longer bars indicate slower requests.
2. Check the **Duration** column for the exact time in milliseconds.
3. Use the waterfall tooltip to see the TTFB breakdown: a long light section means the server was slow to respond; a long dark section means download was slow.
### Identifying cached vs. fetched resources
1. Look at the **Size** column for `(memory cache)` or a byte count.
2. Click the row and check the **General** section in the details sidebar for cache status.
3. The waterfall bar is rendered at reduced opacity for pending requests.
### Filtering by resource type
Use the type filter buttons (CSS, JS, Fetch/XHR, etc.) to focus on specific request categories, then use the text filter to narrow by URL.
## Technical Details
The Network Panel integrates three data sources:
1. **Fetch/XHR capture** — Wraps `window.fetch` and `XMLHttpRequest.prototype` to intercept requests and buffer method, URL, headers, and bodies. Emits phased payloads (`start` → `response` → `body`, or `error`) that are merged by request ID.
2. **Performance API** — `performance.getEntriesByType("navigation")` and `performance.getEntriesByType("resource")` provide timing and size for all resources loaded by the page.
3. **Background webRequest log** — The background worker records HTTP method, status code, and headers via the `chrome.webRequest` API, covering requests that the live capture may miss.
Each request is de-duplicated across sources by matching URL and start time. Live fetch/XHR captures include full headers and request/response bodies; Performance and webRequest entries provide timing, size, method, and status only.