

Console Panel
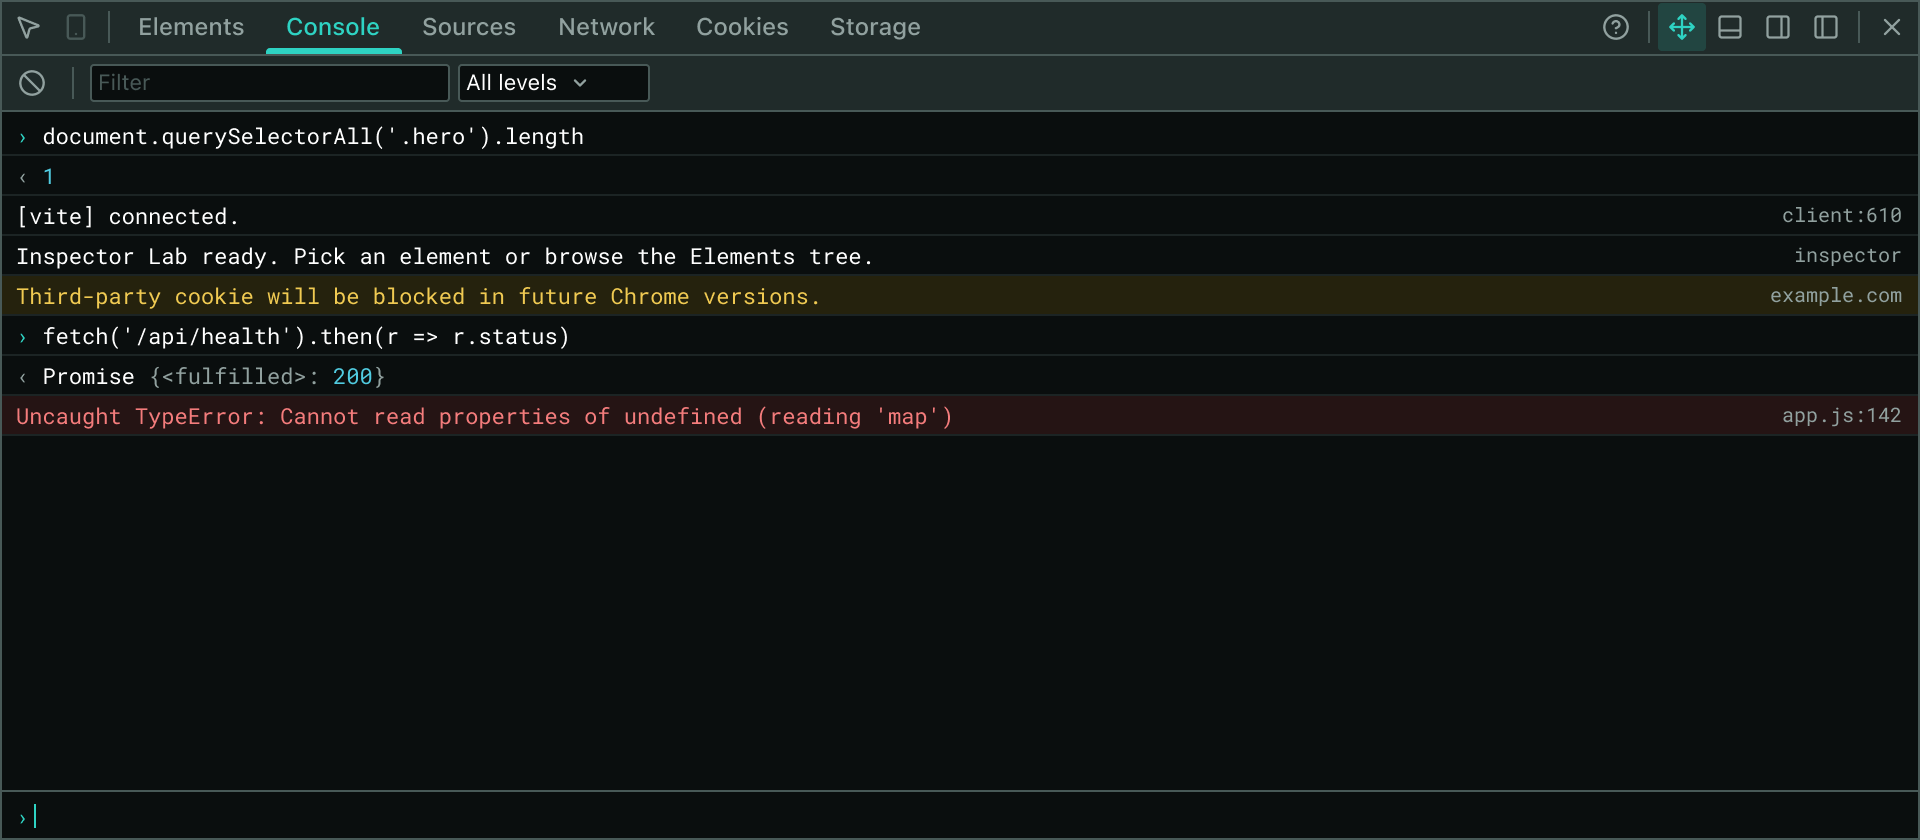
The Console Panel is Inspector Lab's interface for inspecting and interacting with the page's console output. It captures logs, errors, warnings, and info messages, displays them with syntax coloring, and provides an input prompt where you can evaluate JavaScript expressions in the page's context.
Overview
The Console Panel functions as a text-based REPL (read-eval-print loop) embedded within the extension. It:
- Captures all console calls from the page's main world (
console.log,console.error,console.warn,console.info,console.debug) - Preserves early logs — messages logged before Inspector Lab opens are buffered and replayed when the panel connects
- Renders with syntax coloring — primitives (numbers, booleans, strings, nullish values) are colored by type, matching Chrome DevTools' conventions
- Shows call sites — the
file:linesource location is displayed right-aligned like DevTools - Evaluates expressions — type JavaScript into the prompt at the bottom to run it in the page's global scope and see the result
- Filters and sorts — search messages by text and filter by level (All, Errors, Warnings, Info)
Layout & Controls
The panel is stacked into three regions, top to bottom:
Toolbar
- Clear button — Clears all messages from the list (does not affect the page's actual console).
- Filter input — Search for a substring in the message text (case-insensitive).
- Level dropdown — Show all messages, only errors, only warnings, or info + log messages.
Message List
Each message is rendered as a single row with:
- Level indicator — An implicit color and styling based on the message's level (log, info, warning, error, input, result).
- Message content — The formatted output of the original
console.call(), with primitive values toned by their type. - Source tag — The calling file and line number, if available (e.g.,
app.js:42).
Prompt Row
At the bottom, a text input prefixed with the › chevron lets you type JavaScript expressions. Press Enter to evaluate. The result appears in the message list as a "result" level entry, colored by its type.
Message Levels & Styling
| Level | Color | Usage |
|---|---|---|
| log | Default text | console.log() — neutral information |
| info | Info tone | console.info() — informational messages |
| warning | Warning background & text | console.warn() — warnings with background highlight |
| error | Error background & text | console.error() — errors with background highlight |
| input | Accent color for chevron | Lines you typed into the prompt |
| result | Subtle text | The result of evaluating an input expression |
Syntax Coloring
Within neutral-level messages, individual arguments are toned by their type:
- Numbers and BigInt — rendered in the number color
- Booleans — rendered in the keyword color
- Strings — rendered in the string color
- Nullish (
null,undefined) — rendered in subtle text - Other — rendered in plain text
Error and warning messages keep their level color for the entire row; toning is suppressed.
Format Specifiers
The Console Panel supports Chrome's format specifiers when the first argument is a string:
%s— Convert to string%d/%i— Convert to integer%f— Convert to float%o/%O— Object formatting (same as no specifier)%c— CSS styling (ignored; no styling is applied in the text panel)%%— Literal%
Extra arguments after all specifiers are appended space-separated to the output, matching Chrome's behavior.
console.log("User %s is %d years old", "Alice", 30);
// Output: "User Alice is 30 years old"

console.log("Value: %o", { x: 1, y: 2 });
// Output: "Value: {x: 1, y: 2}"
Evaluating Expressions
Type any valid JavaScript expression into the prompt and press Enter. The expression is evaluated in the page's global scope (the window object) with the same privileges as a page script — no extension APIs leak in.
Result Display
- If evaluation succeeds, a "result" row is appended showing the preview of the return value, toned by type.
- If an error is thrown, an "error" row shows the error name and message.
- If the site's Content Security Policy blocks
eval, a CSP violation message is shown (as CSP exceptions cannot be bypassed by an in-page inspector, unlike browser DevTools).
Value Descriptions
Results are rendered as plain-text previews, not live objects. Complex values are abbreviated:
- Objects — shown as
{key: value, …}with up to 10 properties; deeper nesting shows{…}. - Arrays — shown as
(length) [item, item, …]with up to 10 items; overflow shows… N more. - Functions — shown as
ƒ name(). - Promises — shown as
Promise (value not awaited)— the panel does not automatically await async results. - DOM elements — shown as
<tagname#id.class>. - Window — shown as
Windowwithout enumerating its hundreds of properties.
Buffering & Early Logs
Console Prehook runs as a document-start content script, capturing console.* calls from the moment the page begins to load. If Inspector Lab opens after the page has already logged messages, those logs are held in a bounded buffer (up to 1000 entries) and replayed when the Console Panel first connects. This ensures you never miss boot-time logs or initialization warnings.
Each message is capped at 2000 characters; longer outputs are truncated with an ellipsis (…) and lose their tone information.
Limitations & Edge Cases
- Async results — Expression results are not awaited. Promises show as
Promise (value not awaited). - Live objects — All previews are plain-text snapshots; you cannot interact with live references in the page.
- Revoked proxies & hostile objects — If
toString()throws, the panel falls back toObject.prototype.toString.call(). - Cross-origin frames — Only the main frame's console is captured; iframes are not included.
- CSP violations — If the page forbids
eval, expression evaluation fails with a CSP error message.